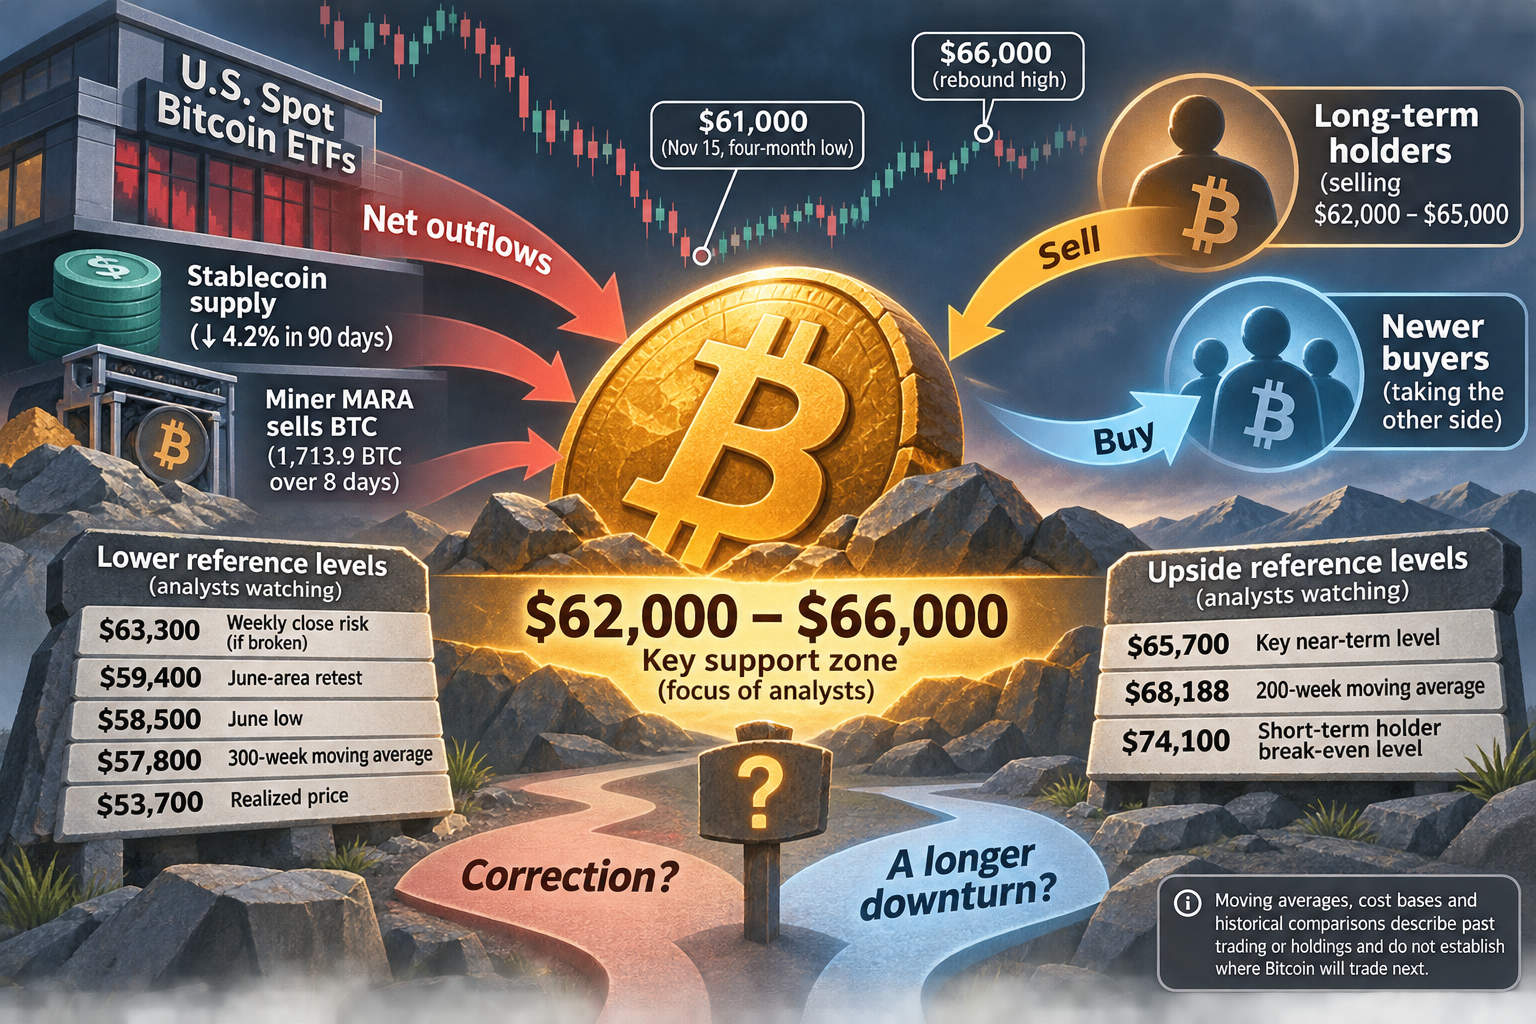
In its November 18, 2026 market report, PANews described a test of demand after several weeks of Bitcoin declines. BTC briefly fell to about $61,000 on November 15, a four-month low, before rebounding as high as roughly $66,000. The report said the buying had not yet proved durable. The central question was whether the decline was a correction or the start of a longer downturn—not whether a particular price was guaranteed to hold.
Flows and holder cost bases
According to the report, U.S. spot Bitcoin ETFs recorded $2.6 billion in net outflows over the preceding 10 trading days, including $240 million on November 17. Stablecoin supply fell 4.2% over the preceding 90 days. PANews also reported that miner MARA sold 1,713.9 BTC, worth approximately $121 million, over eight days, bringing its reported sales for the year to more than $3 billion. These figures describe possible pressures on demand and supply; they do not establish how much each factor moved Bitcoin’s price.
Several analysts focused on the $62,000–$66,000 range. Glassnode identified an area near the August low where short-term holders had acquired about one-fifth of their holdings; it said buyers took in roughly 66,000 BTC there during two particularly heavy selling days. CryptoQuant reported substantial selling by long-term holders between $62,000 and $65,000, with newer buyers taking the other side.
Holder cost basis—the price at which coins were acquired—can help locate where owners may face losses, but it is not a price floor. Darkfost estimated that, excluding coins held for more than 10 years, 46% of circulating supply was in profit; at $62,000, that share fell to 37.8%.
Levels analysts were watching
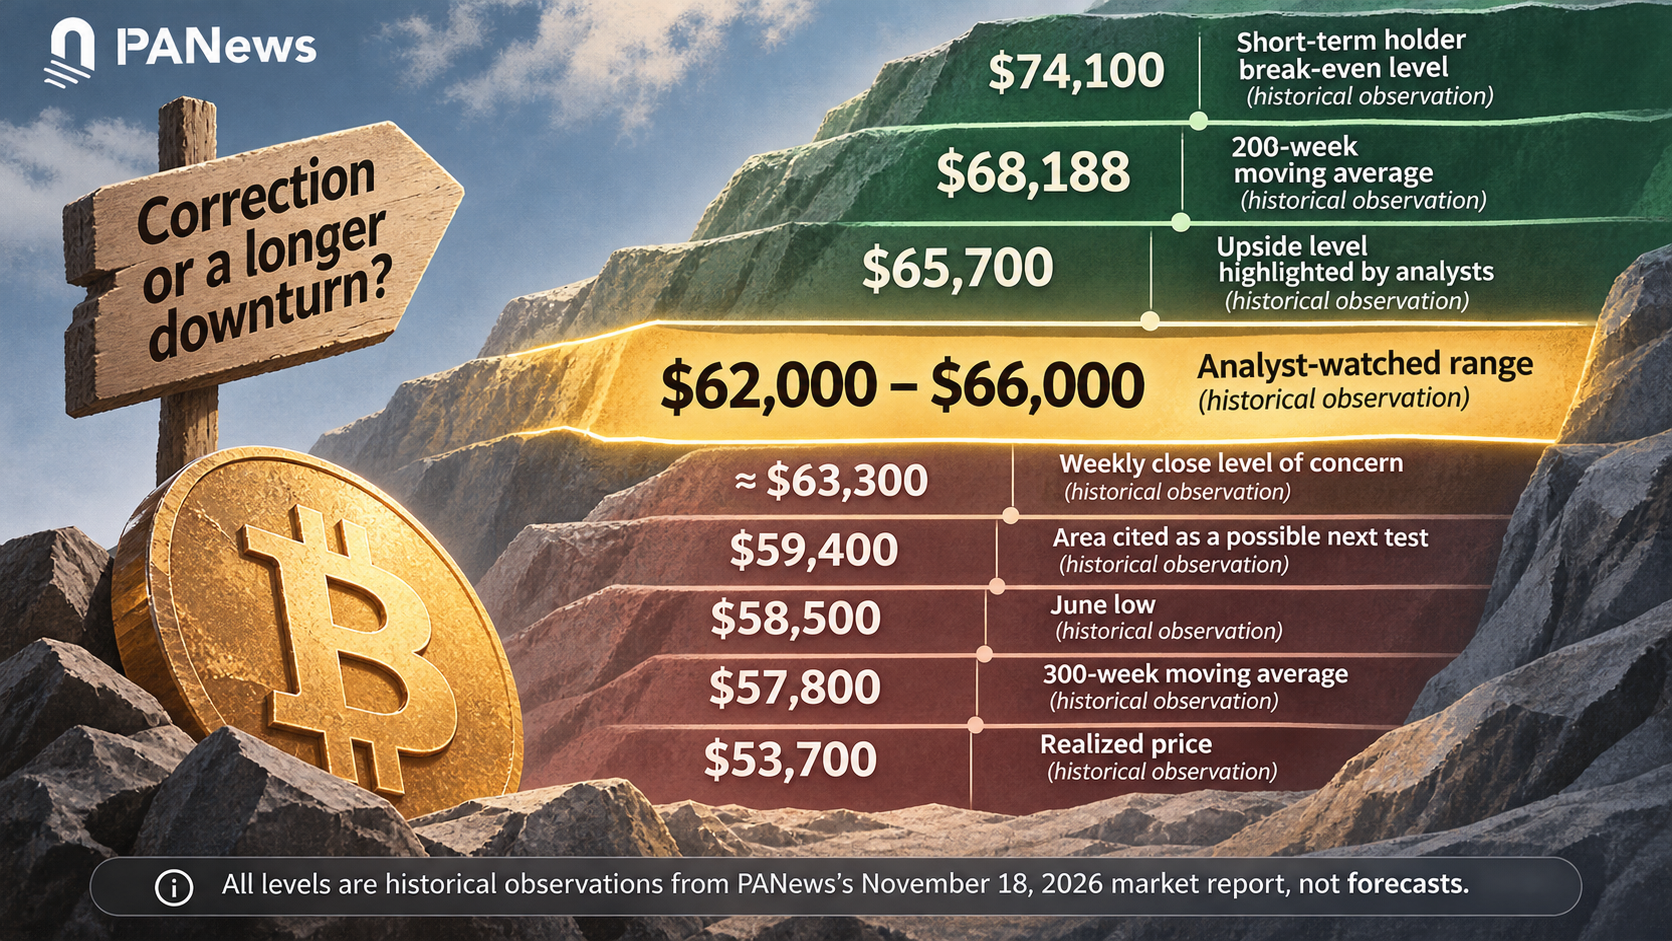
Rekt Capital warned that a weekly close below approximately $63,300 could be followed by another move toward the $59,400 area seen in June. The report also listed the June low near $58,500, a 300-week moving average near $57,800 and Bitcoin’s realized price near $53,700 as lower reference levels. On the upside, Rekt Capital and Martini Guy emphasized $65,700; the report placed the 200-week moving average near $68,188 and the short-term holder break-even level near $74,100.
Wintermute’s trading team argued that, without a daily recovery above the 200-week moving average and renewed ETF inflows, a rebound could reflect short covering rather than a trend reversal. Moving averages, cost bases and historical comparisons describe past trading or holdings. None can establish where Bitcoin will trade next or whether it will preserve purchasing power.