In trading described in a report published November 21, 2026 (UTC+8), Bitcoin fell below $60,000. The cited daily chart put BTC at $59,703.72, down 3.55% for the session, after it touched $59,300.13. The Crypto Fear and Greed Index stood at 9—classified as “extreme fear”—compared with 18 a week earlier and 51 a month earlier. A reading of 9 was its lowest since February, though not its lowest of 2026: the index had reached 5 on February 5.
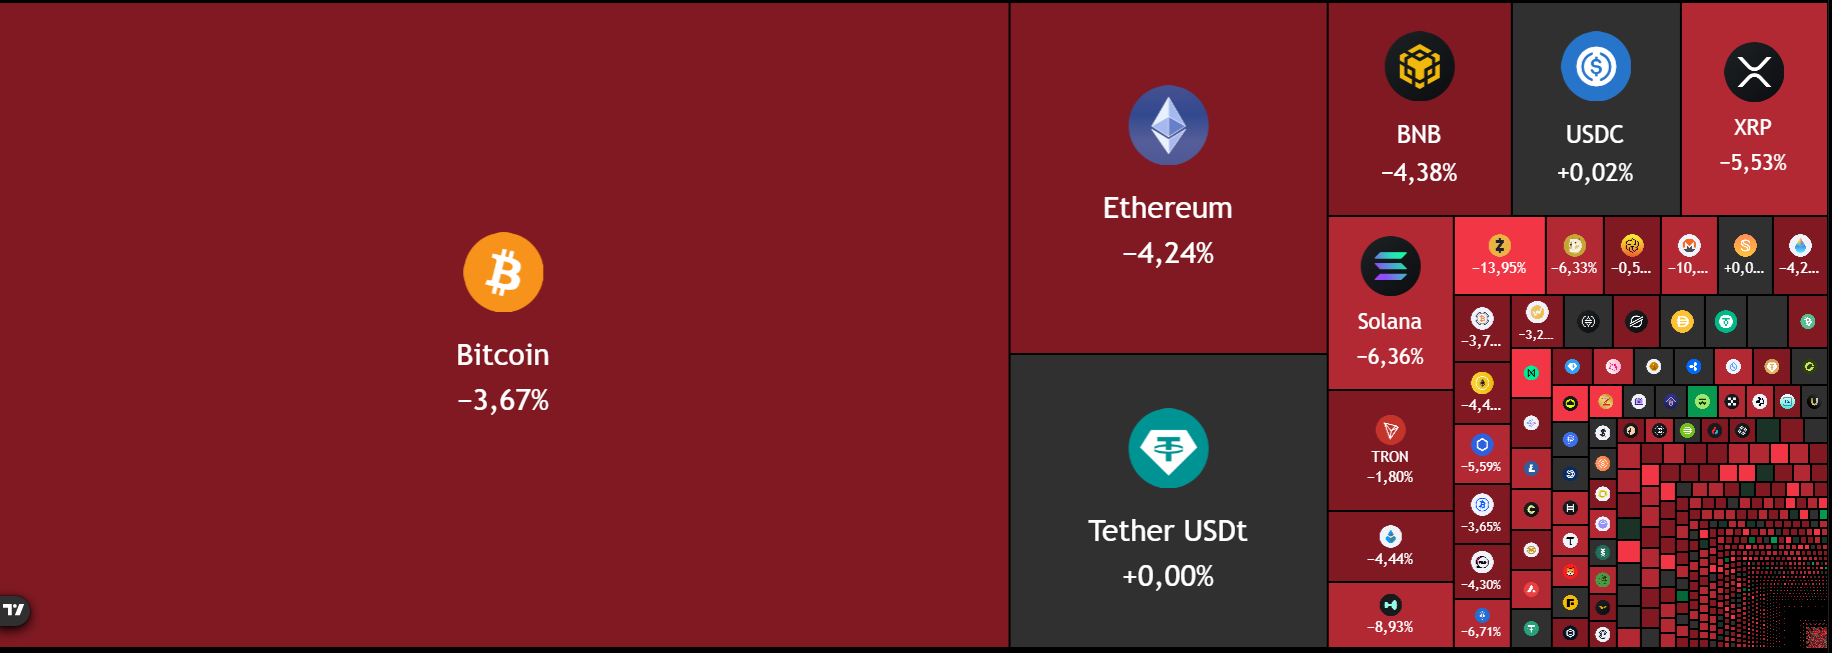
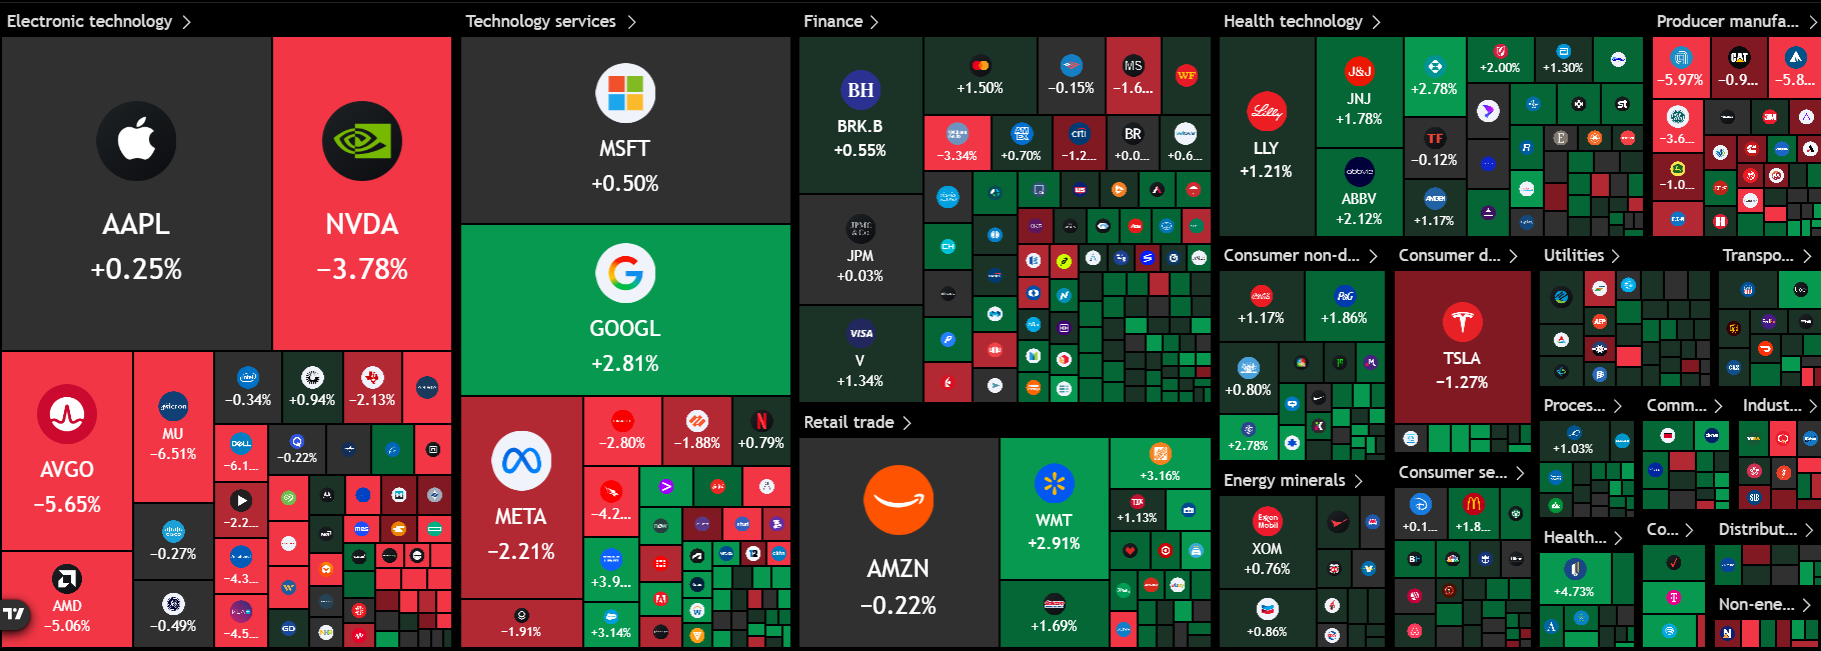
Selling extended beyond Bitcoin. Decrypt reported that roughly $727 million in leveraged crypto positions had been liquidated over 24 hours, about 86% of them bullish positions. It also reported $582.2 million in withdrawals from U.S. spot Bitcoin ETFs on Thursday and roughly $2.9 billion in November outflows by that point. Those withdrawals had begun before Anthropic’s stock-market debut, so the listing alone does not explain them.
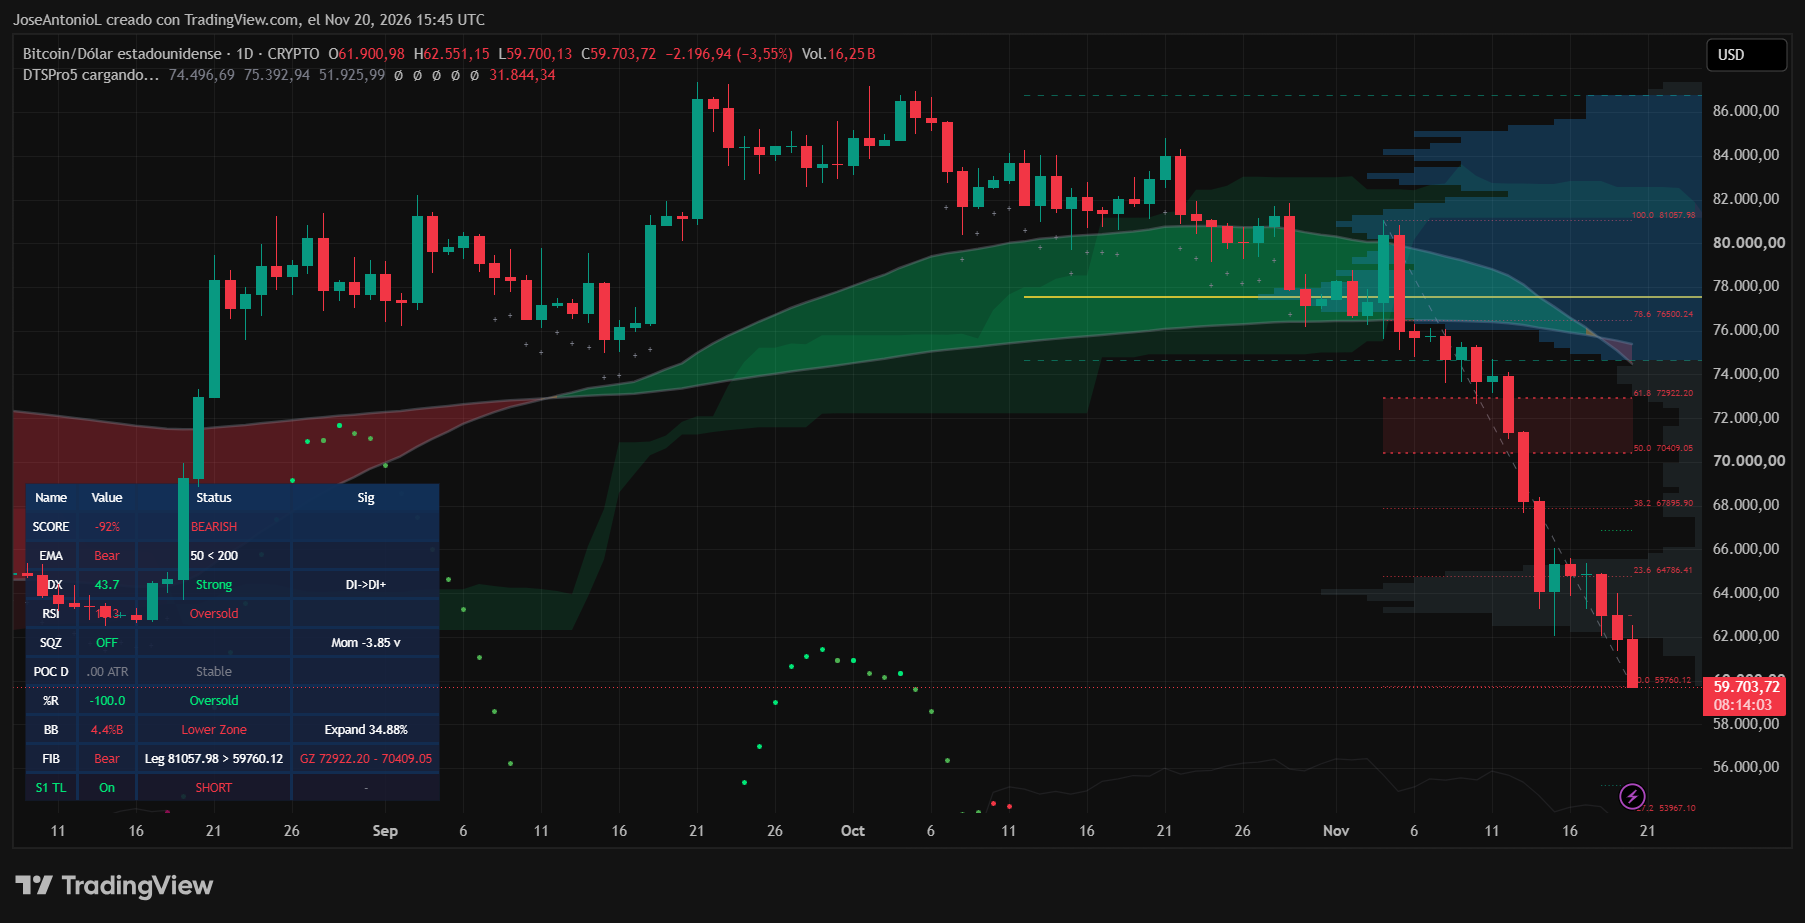
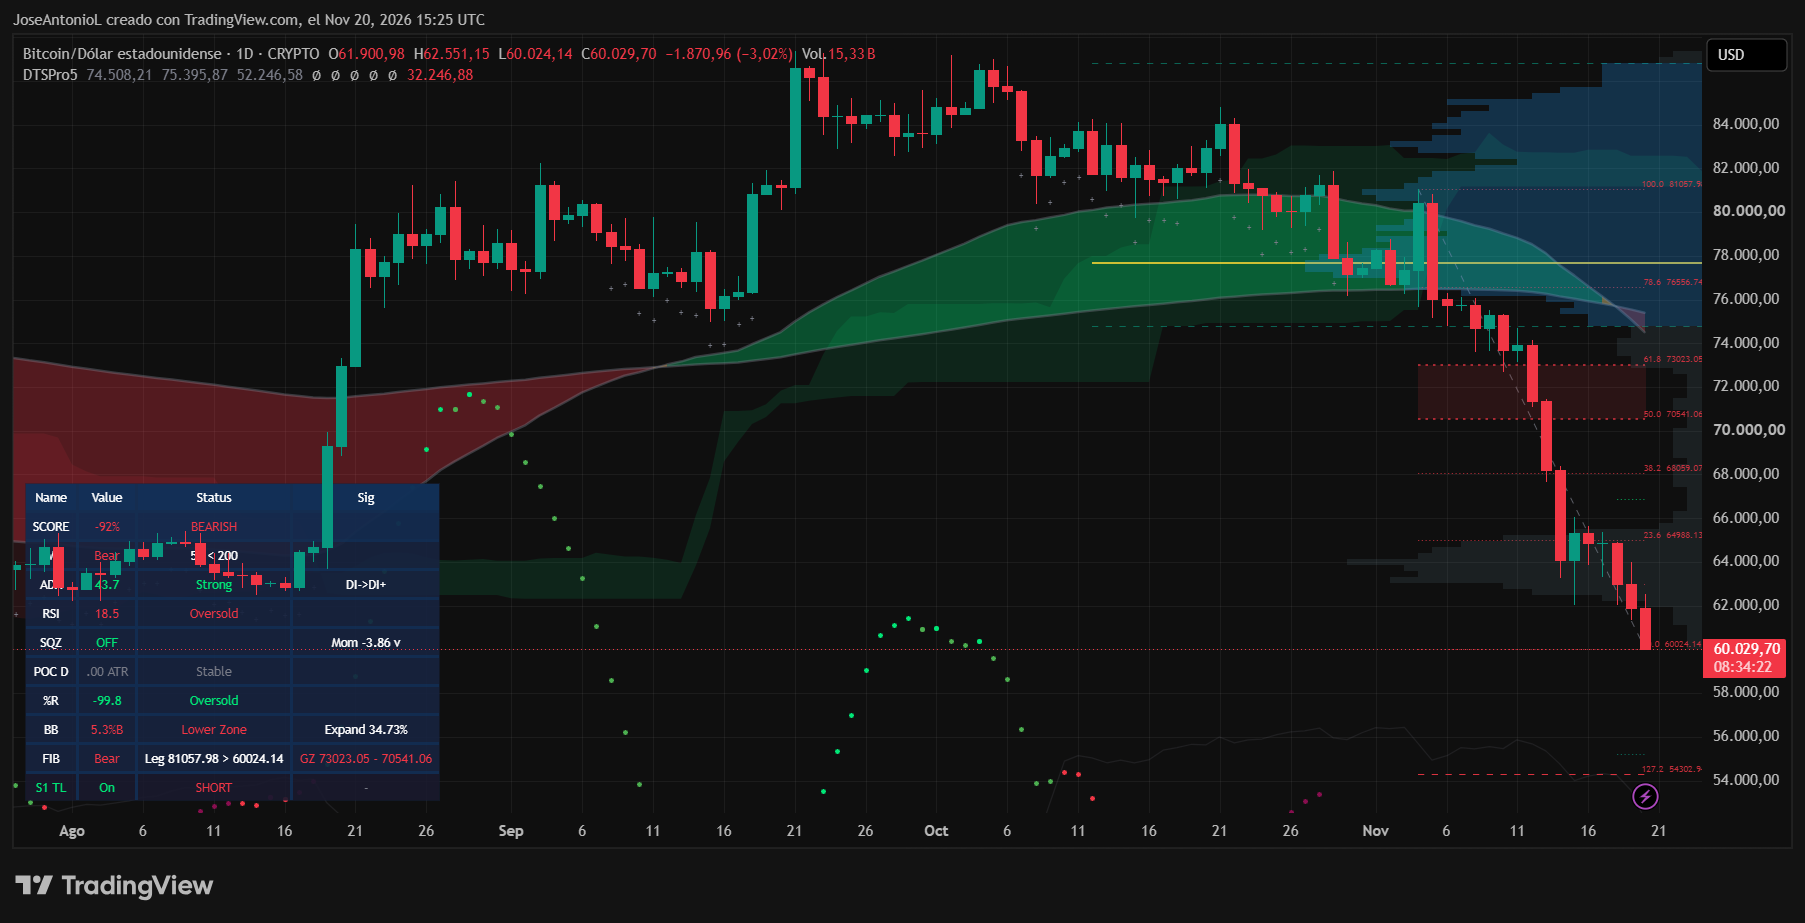
The price chart showed Bitcoin below its 50-day and 200-day exponential moving averages, with the shorter-term average also below the longer-term one. Its relative strength index was in the teens, a reading commonly described as oversold. Neither indicator establishes when a decline will end. The report identified roughly $58,000–$59,000 as a historical price area to watch after the break below $60,000, not a guaranteed floor.
For a store-of-value comparison, the episode illustrates a distinction between Bitcoin’s monetary properties and its market price. The reported decline and ETF withdrawals document short-term selling pressure; they do not, on their own, establish how reliably Bitcoin protects purchasing power over longer periods.