In a market report published on November 17, 2026, Glassnode Insights described a sharp Bitcoin sell-off after more than a month of narrow trading. Bitcoin fell about 13% over the preceding week, briefly dropped below $63,000 on Saturday, and traded around $64,000 on Monday. The Saturday low was its lowest since late August, according to the report.
The question for Bitcoin’s store-of-value case is not whether one volatile week settles it. It is what the sell-off reveals about holders’ cost bases, the use of leverage and the willingness of investors to keep holding through a loss.
Leverage fell, while ETF outflows continued
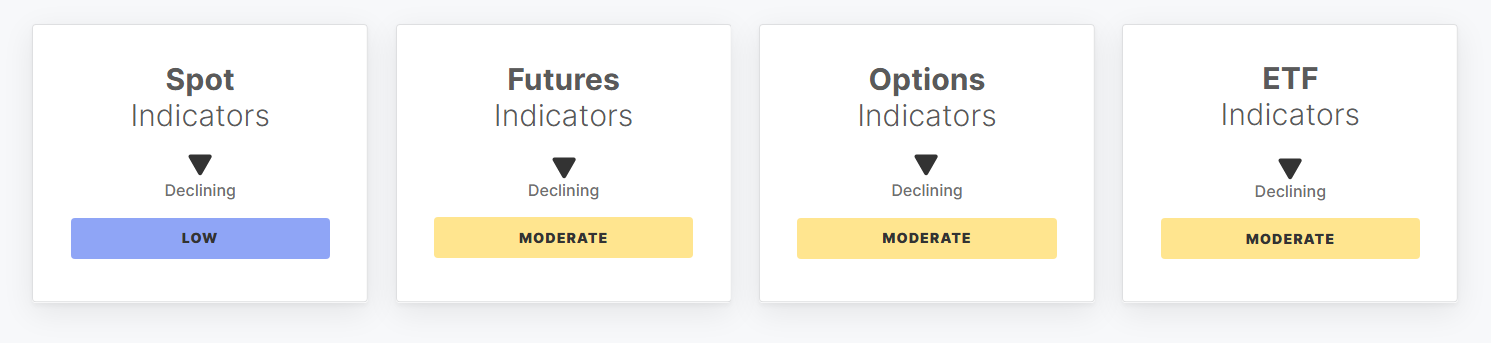
Glassnode reported that futures open interest fell 7.2% from the prior week to $34.2 billion. Perpetual-contract funding rates, which had spent several weeks in an elevated range, returned to neutral territory. Its measure of aggressive selling in perpetual contracts, perpetual CVD, widened from −$493 million to −$1.4 billion.
Selling was also visible in spot trading. Spot CVD deteriorated from −$51.5 million to −$133.7 million, while the report’s price-momentum reading fell from 35.6 to 22.8, a reported decline of 36.1%. In options, 25-delta skew rose 30.9% to 13.7%, indicating a higher premium for downside protection; Glassnode said it was the strongest such reading since August.
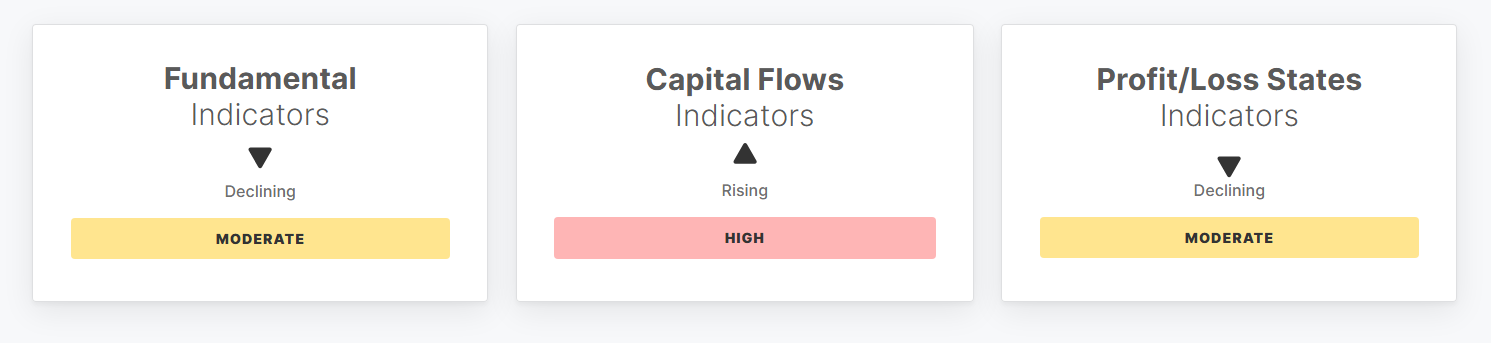
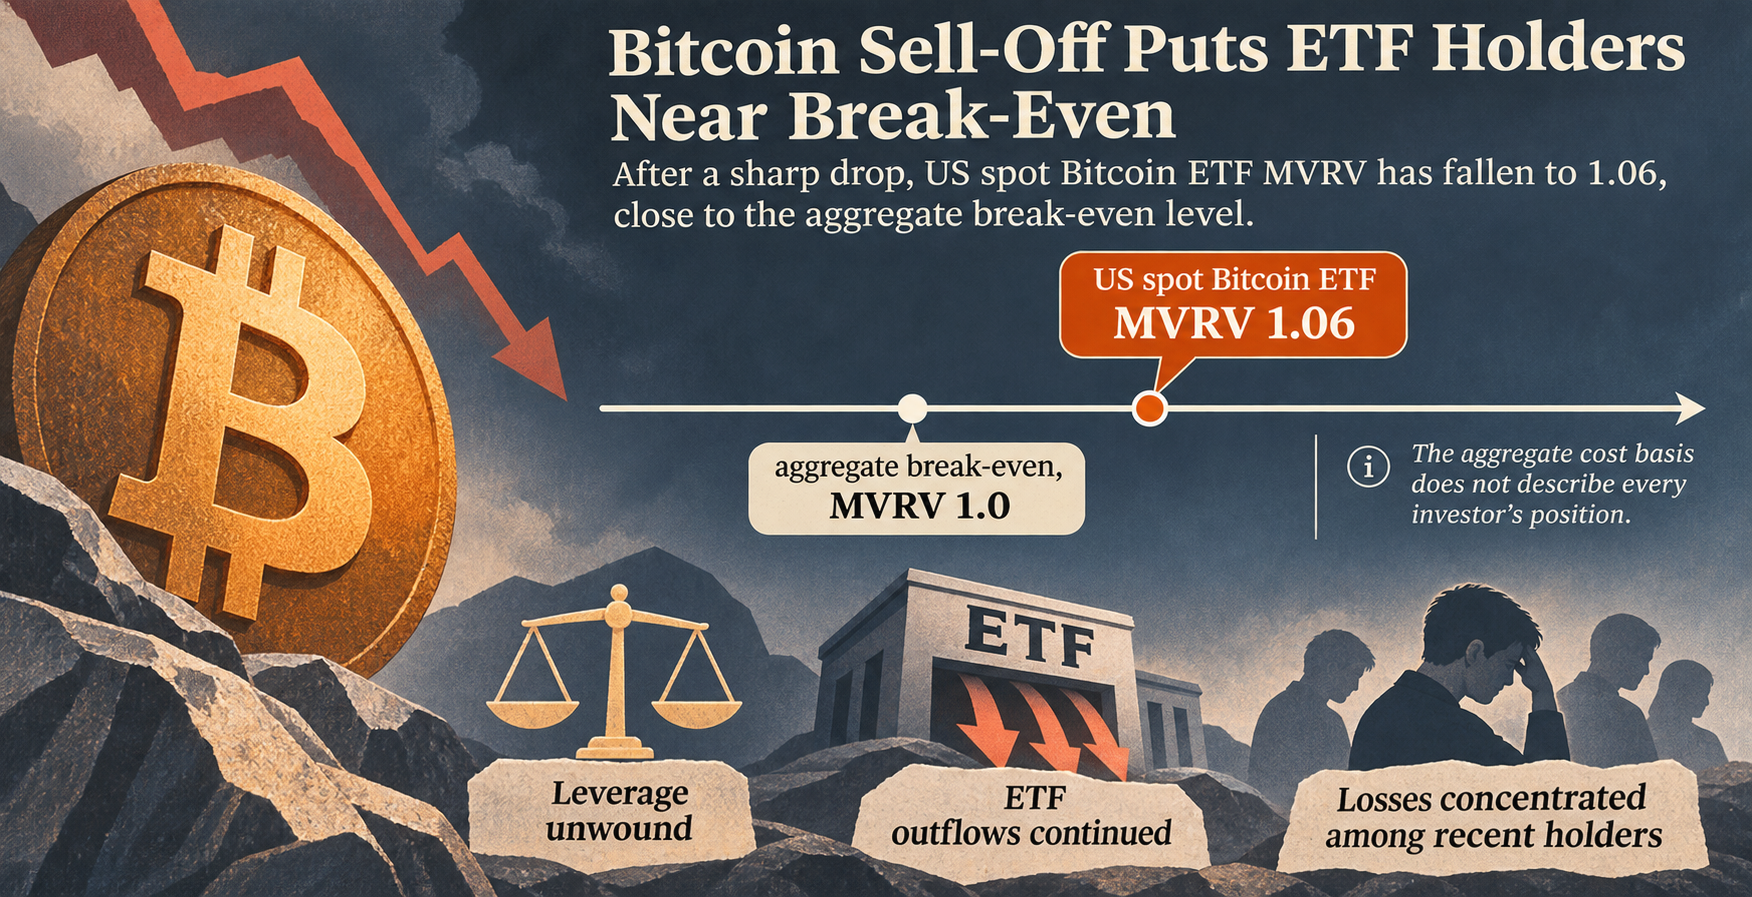
US spot Bitcoin ETFs recorded net outflows on every trading day of the preceding week. Weekly net outflows totaled $995.4 million, despite narrowing slightly from the previous week, and weekly trading volume fell to $11.5 billion. Glassnode put the ETFs’ aggregate MVRV—a measure comparing market value with estimated cost basis—at 1.06, close to the 1.0 level that represents aggregate break-even in that measure. It does not mean every ETF investor bought at the same price or is individually close to break-even.
Losses were concentrated among recent holders
The report said entity-adjusted on-chain transfer volume rose 3.6% to $5.4 billion a day, while daily active addresses were about 659,700. Those activity measures remained relatively resilient even as the estimated monthly growth rate of Bitcoin’s realized capitalization slowed from 0.43% to 0.04%. Realized-cap growth is a measure of changes in the network’s estimated cost basis, not a direct count of new cash entering the market.
The share of Bitcoin supply in profit fell from 60.4% to 55.3%. Short-term holders’ net unrealized profit or loss turned negative, reaching −7.4%; the report also said realized losses were at their highest since July. Its short-term-to-long-term holder supply ratio edged up to 15.1%, while its “hot capital” share remained at 22.0%. These are different measures, but both informed Glassnode’s assessment that recently acquired coins remained important to trading activity.
Glassnode attributed the decline to a combination of ETF selling, the unwinding of speculative long positions and broader risk aversion. That is the report’s interpretation, not proof that any one factor caused the price move. It identified ETF flows and the behavior of short-term holders as indicators to watch around $64,000; the data do not establish that level as a durable floor. Likewise, a week of losses neither proves nor disproves Bitcoin’s long-term ability to preserve purchasing power.